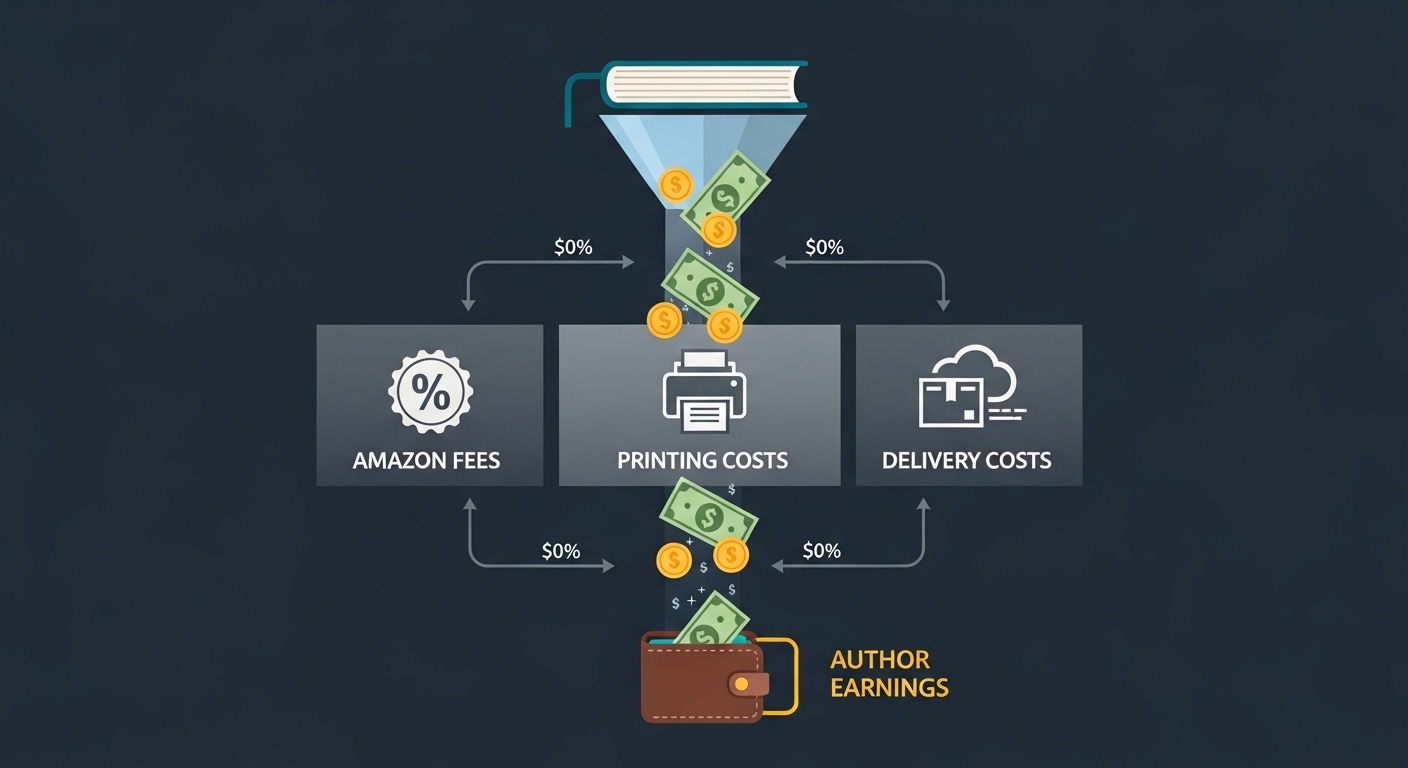
If you’ve spent even a few minutes researching publishing eBooks on Amazon KDP, you’ve probably encountered the widely promoted claim: “Earn up to 70% royalties.”
At face value, this sounds clean and predictable. You publish, set a price, and retain most of each sale. But that interpretation oversimplifies a system that is, in reality, layered and conditional. Your actual earnings are shaped by multiple variables operating simultaneously—pricing thresholds, file delivery costs, geographic pricing differences, and reader consumption models like Kindle Unlimited. Each factor subtly adjusts your net outcome.
This is where many new authors miscalculate. They anchor their expectations to the headline percentage instead of the effective royalty. Over time, these small misunderstandings compound into significant revenue gaps. Understanding how KDP royalties function in practice—not just in theory—is essential. Because the difference between a well-optimized book and a poorly optimized one isn’t just visibility—it’s how much money you actually keep per sale.
The Core Royalty System: Why 35% vs 70% Is More Strategic Than It Looks
At the center of Amazon KDP’s monetization model lies a decision that appears binary but is actually strategic: choosing between 35% and 70% royalties.
Most authors instinctively gravitate toward 70%, assuming it’s always superior. However, this assumption ignores the conditional framework that governs eligibility and the downstream implications of each model.
The decision is not simply about maximizing percentage—it’s about aligning your pricing, audience, and content format with the most efficient earning structure. A poorly aligned 70% strategy can underperform a well-executed 35% approach in certain contexts.
Understanding when to prioritize flexibility over margin—or vice versa—is what separates intentional publishing from guesswork. This choice directly influences not only your per-sale earnings but also your broader pricing strategy and market positioning.
The 70% Royalty Model: High Potential, Built-In Constraints
The 70% royalty model is designed for commercially viable books that fit within Amazon’s preferred pricing ecosystem. It offers higher margins, but only when specific criteria are met and maintained consistently.
To qualify, your book must fall within a defined pricing window (typically $2.99–$9.99), be available in supported regions, and meet certain distribution conditions. These constraints are not arbitrary—they ensure pricing consistency across global markets.
However, the critical nuance is this: your 70% is calculated after delivery costs are deducted. This shifts your effective royalty downward, sometimes significantly for larger files.
For authors aiming to scale income through consistent sales volume, this model offers strong upside. But that upside only materializes when you actively optimize pricing, formatting, and distribution rather than treating the 70% rate as guaranteed profit.
The 35% Royalty Model: Flexibility Over Efficiency
The 35% royalty option is often dismissed as inferior, but it serves a distinct and valuable purpose within a broader publishing strategy.
Unlike the 70% model, it allows complete pricing freedom. You can price below $2.99 for aggressive entry strategies or above $9.99 for premium positioning without losing eligibility. This flexibility becomes particularly useful in testing phases or niche markets.
Another overlooked advantage is the absence of delivery fees. What you earn is straightforward—35% of the list price—without additional deductions tied to file size.
That said, the limitation is clear: your earning ceiling per sale is lower. This makes the model less suitable for long-term scaling but highly effective for visibility campaigns, short-form content, or funnel-based strategies where profit per unit is not the primary objective.
Royalty Model Comparison
| Factor | 70% Royalty Model | 35% Royalty Model |
| Pricing Range | Restricted to optimal band | Fully flexible |
| Delivery Fees | Applied per MB | None |
| Earnings Per Sale | Higher but adjusted | Lower but predictable |
| Strategic Use | Scaling revenue efficiently | Testing, promotion, experimentation |
The key takeaway is that royalty models are not static decisions. They should evolve alongside your pricing strategy, audience growth, and publishing goals.
Delivery Costs: The Hidden Variable That Shrinks Your Profit
Delivery costs are one of the most overlooked aspects of KDP publishing, yet they have a direct and measurable impact on your earnings—particularly under the 70% royalty model.
These costs are calculated based on your eBook’s file size and deducted before your royalty is applied. This means your “70%” is not applied to the full list price, but to a reduced amount after fees.
What makes this especially important is that delivery costs scale with volume. A small per-sale deduction becomes significant over hundreds or thousands of transactions, effectively acting as a silent margin reducer.
Authors who ignore this factor often find their actual earnings falling short of projections, not because of poor sales—but because of inefficient file optimization.
Why File Size Isn’t Just a Technical Detail
File size is not merely a formatting concern—it is a financial variable. Every design decision you make, from embedded images to font choices, influences the weight of your final file.
For instance, a text-based manuscript might remain under 1 MB, resulting in negligible delivery costs. In contrast, a heavily illustrated book or one using high-resolution graphics can easily exceed 10 MB, increasing per-sale deductions.
The key is not to eliminate quality visuals, but to optimize them. Compressing images, using appropriate resolutions, and avoiding unnecessary media can significantly reduce file size without compromising reader experience.
In this context, formatting becomes part of your profit strategy—not just presentation.
Long-Term Impact of Delivery Costs
The cumulative effect of delivery fees becomes clear when viewed at scale. What seems like a minor deduction per sale compounds rapidly as volume increases.
For example, a $0.20 delivery fee:
- At 100 sales → $20 lost
- At 1,000 sales → $200 lost
- At 10,000 sales → $2,000 lost
This is not a marginal issue—it’s a structural cost that directly affects your bottom line. Authors who optimize early retain more of their revenue as they grow, while those who ignore it effectively leak profit over time.
Delivery Cost Impact Table
| Book Type | File Size | Delivery Cost | Profit Impact |
| Text-based | <1 MB | Very low | Near-max margin retained |
| Mixed content | 5–8 MB | Moderate | Noticeable margin reduction |
| Image-heavy | 10+ MB | High | Significant profit erosion |
Real Earnings Per Sale: Breaking Down the Numbers
Understanding theoretical royalty percentages is useful—but what matters is actual take-home earnings per transaction. When you factor in pricing tiers, delivery costs, and royalty models, your real earnings often differ from initial expectations. This section translates abstract percentages into concrete numbers. These examples reflect typical scenarios, but your exact results will vary depending on file size, region, and pricing strategy. Still, they provide a realistic baseline for planning.
Entry-Level Pricing ($2.99)
At $2.99, you’re positioned at the lower end of the 70% royalty band. This price is commonly used to attract new readers while maintaining eligibility for higher royalties. After a typical delivery cost of around $0.15, your net earnings fall between $1.90 and $2.00. This makes it a strong entry point for authors prioritizing discoverability without sacrificing too much margin.
Mid-Range Pricing ($4.99)
This range is often considered optimal for balancing affordability with profitability. Readers perceive it as reasonable, while authors benefit from improved per-sale earnings. With a slightly higher delivery cost, your net typically lands between $3.30 and $3.50. This tier is widely used in established niches where value perception supports higher pricing.
Premium Pricing ($9.99)
At the upper boundary of the 70% model, $9.99 maximizes potential earnings per unit. However, it introduces friction—readers become more selective at this level. After deductions, you retain approximately $6.70 to $7.00 per sale. This strategy works best for specialized, high-value content where demand justifies the price.
Low Pricing ($0.99)
This price falls under the 35% model, making it unsuitable for profit-focused strategies. Earnings typically range from $0.30 to $0.35 per sale. Its primary function is visibility—driving downloads, reviews, or funnel entry rather than generating revenue directly.
Earnings Comparison Table
| Price | Model | Earnings per Sale |
| $0.99 | 35% | ~$0.35 |
| $2.99 | 70% | ~$1.95 |
| $4.99 | 70% | ~$3.40 |
| $9.99 | 70% | ~$6.80 |
Kindle Unlimited: When Engagement Replaces Sales
Kindle Unlimited (KU) fundamentally changes the earning model by shifting from ownership to access. Instead of purchasing books, readers borrow them—and authors are compensated based on engagement.
This transforms your revenue driver from pricing strategy to reader behavior.
How KU Payments Actually Work
Amazon allocates a global fund each month, which is distributed among authors based on total pages read. The payout rate fluctuates but generally falls between $0.004 and $0.005 per page.
Your earnings are directly tied to how much of your book readers consume—not whether they download it.
Why This Model Changes Everything
In KU, engagement becomes the primary metric. A shorter but highly engaging book can outperform a longer one with poor retention. This shifts focus toward pacing, readability, and narrative flow. Authors who understand this dynamic optimize for completion rates, not just length.
Example Calculation
For a 300-page book:
- Full read at $0.004/page
- Total earnings ≈ $1.20 per reader
This may seem lower than direct sales, but high read-through rates across multiple readers can generate consistent income.
Pricing Psychology: The Balance Between Perception and Profit
Pricing is not purely economic—it’s behavioral. Readers interpret price as a signal of quality, credibility, and value. A price that’s too low may undermine perceived quality, while a price that’s too high introduces hesitation unless justified by strong positioning.
Strategic Pricing Thinking
Instead of focusing on maximum price, effective authors ask:
What price optimizes both trust and conversion?
This often involves iterative testing—starting lower to gain traction, then gradually increasing as reviews and authority build. Pricing becomes a dynamic lever rather than a fixed decision.
Global Sales: Why Your Earnings Vary by Region
KDP operates across international markets, and each region behaves differently in terms of purchasing power, pricing sensitivity, and tax structures.
This means your earnings are not uniform—they vary depending on where your readers are located.
Regional Impact Table
| Region | Buyer Behavior | Earnings Impact |
| US/UK | Value-driven | Highest overall returns |
| India | Price-sensitive | Lower per-sale margins |
| EU | Regulated markets | Tax-adjusted earnings |
Understanding this helps you interpret your revenue more accurately and refine your pricing strategy for global reach.
Taxes and Final Payout: What Actually Hits Your Account
The royalties shown in your dashboard are not always identical to what you receive. Several backend adjustments influence final payouts. These include withholding taxes (depending on your country), currency conversion rates, and payment processing timelines. Being aware of these factors prevents misaligned expectations and helps you forecast your actual income more accurately.
Volume vs Margin: The Real Income Strategy
A common mistake is focusing solely on earnings per sale. While important, it doesn’t capture the full picture of sustainable income. Revenue is a function of both margin and volume. In many cases, a lower price with higher sales frequency outperforms a high-price, low-volume model.
Revenue Comparison
| Strategy | Sales | Profit/Sale | Total |
| High price, low sales | 10 | $6 | $60 |
| Lower price, volume | 50 | $2 | $100 |
This illustrates why scalability often matters more than per-unit optimization.
Building a Sustainable Income Model
Long-term success on KDP is not built on a single book or pricing decision—it’s built on systems. This includes publishing multiple books within a niche, leveraging both KU and direct sales, and continuously adjusting pricing based on performance data.
Consistency, not virality, is what drives stable income over time.
FAQs
How much can I realistically earn per sale?
Typically between $0.30 and $7, depending on pricing, royalty model, and delivery costs. Your effective earnings depend more on optimization than headline percentages.
Is Kindle Unlimited worth it?
It depends on your content style. Highly engaging, binge-worthy books tend to perform best within KU’s page-read model.
Can I change pricing anytime?
Yes. In fact, regular testing is recommended to identify optimal pricing for your audience and niche.
Do all books pay delivery fees?
No. Delivery fees only apply under the 70% royalty model and are based on file size.
Final Thoughts: Earnings Are Designed, Not Assumed
At a glance, Amazon KDP appears simple: publish, price, and earn a percentage. But beneath that simplicity lies a system shaped by multiple interacting variables. Your actual income is not determined by one decision—it’s the outcome of pricing, formatting, positioning, and reader engagement working together. Authors who succeed don’t rely on default settings. They refine, test, and optimize continuously.
Because in self-publishing, your earnings aren’t fixed—they’re engineered.